Understanding Cholesterol
Written December 2023
This article does NOT constitute medical advice. Consult with your physician before making any changes to your medical plan.
The topic of cholesterol can be confusing and frustrating. Your doctors says your numbers are high and insists you need to take a medication. But what does it all mean? How can you make an informed decision?
To begin, let's consider the question "Why does cholesterol matter?" Most doctors believe in the Lipid-Heart Hypothesis which postulates that LDL cholesterol (LDL-C) causes plaque to form in the arteries which creates a disease called Atherosclerotic Cardiovascular Disease (ASCVD). This is taught as fact in most medical schools around the world. But does the scientific data and literature support this hypothesis? We will explore this question.
Section I - The Basics
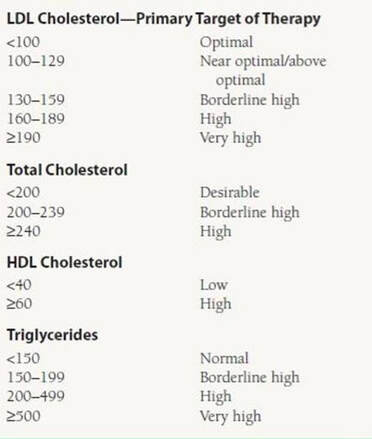
In the blood, cholesterol is largely carried inside of the LDL particle. Our blood is composed mostly of water, and cholesterol is not soluble water, so the human body transports cholesterol inside of a protein that we call low-density lipoprotein (LDL) which is water soluble. Consider the LDL particle as a submarine and cholesterol as a passenger on the submarine. Your doctor has probably ordered blood work for you called a Lipid Panel. It might look something like this:
It's likely that you've been told that LDL-C is "bad" cholesterol and HDL-C is "good" cholesterol. This is misleading. In fact, the cholesterol molecules inside the LDL particle and the cholesterol molecules inside the HDL particle are the exact same chemical molecules. There is no difference between these cholesterol molecules. What is different is the structure and function of the lipoprotein that is transporting these molecules of cholesterol.
When you go to the lab, the lab typically does not directly measure LDL-C. Instead, they measure Total Cholesterol (TC), HDL Cholesterol (HDL-C), and Triglycerides (TG), and then they use a formula to calculate an estimate of your LDL-C. Most labs use the Friedewald Equation to calculate your LDL-C, but there are many different equations. LDL-C calculated values can vary depending on which formula is used. I personally calculate my own numbers, and the difference between, say, the Anandaraja formula and the Cordova formula is 50mg/dL for my numbers. That's a big difference between formulas. In my opinion, the most accurate formula is the Martin-Hopkins formula which usually runs about 4-5mg/dL lower than the Friedewald equation for my personal numbers. But, as long as the same formula is used each time you will be able to notice changes to your values.
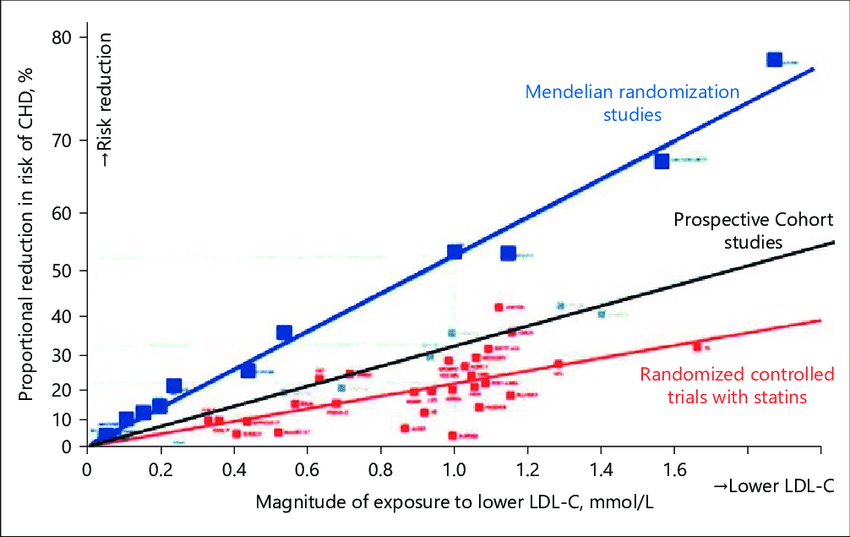
Your doctor has likely told you that your LDL-C must be under 100mg/dL, TC must be under 200mg/dL, HDL-C over 40mg/dL, and TG under 150mg/dL. It is likely that your doctor focuses strongly on LDL-C. Why? In 1985 there were two scientists, Brown and Goldstein, that received a Nobel Prize for their work on LDL-C as it relates to people with very high LDL-C levels in a genetic condition called Familial Hypercholesterolemia (FH). People with this condition have such high levels of LDL-C because the LDL receptor binding property in liver cells is genetically broken. The work of Brown and Goldstein showed a "causal relation between an elevated level of circulating LDL and atherosclerosis" as documented in their paper How LDL Receptors Influence Cholesterol and Atherosclerosis. This and other studies laid the foundation for what is known as the Lipid-Heart Hypothesis. The well-known recent paper called A Critical Review of the Consensus Statement from the European Atherosclerosis Society Consensus Panel 2017 showed positive correlation between reduction in LDL-C and reduction in cardiovascular heart disease (CHD) in the general population. The graph below comes directly from that paper: (please note that the LDL-C units are mmol/L in the graph below, which is a different unit than mg/dL in the chart above)
It is important to understand details about the above graph. The data shows correlation which is different than causation. While LDL-C reduction is positively correlated with reduction of risk of CHD, there could be confounding factors that are the actual cause of CHD. What confounding factors? Well, for example, these studies are conducted in the general population. We know from research that the general population as a whole is metabolically dysfunctional due to the wide spread debilitating diet of the modern world. A recent study in the Journal of the American College of Cardiology called Trends and Disparities in Cardiometabolic Health Among U.S. Adults, 1999-2018 showed that 93% of Americans are metabolically unhealthy. If 93% of the general population is sick, then, knowing that the above study was conducted in that same general sick population, perhaps the increased risk of CHD is due to this population-wide metabolic sickness instead of increased LDL-C levels. Would the results be the same if we isolated the 7% of the population that is metabolically healthy? This is something to consider along with many other factors that might explain an alternative mechanism for CHD causation. We will explore these other mechanisms.
This is NOT medical advice. Consult your doctor for medical advice.
Section II - Other Risk Factors
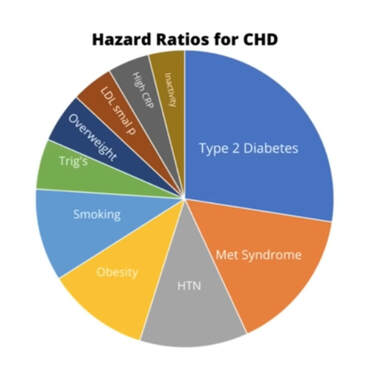
Let's take a closer look at the many risk factors associated with CHD in addition to LDL-C. A 2021 study called Association of Lipid, Inflammatory, and Metabolic Biomarkers With Age at Onset for Incident Coronary Heart Disease in Women looked at hazard ratios for various risk factors. See Table 2 in the study. A hazard ratio (HR) is the ratio of hazard rates of two different variables. For example, if the hazard ratio of A compared to B is 4.0, then that means that A is 4 times the hazard of B per unit time. To make it simpler, Dr. Ken Berry converted the hazard ratios from this study to a pie chart showing percentages of the top 10 risks as they relate to risk factors for CHD.
The first thing you will notice is that LDL-C does not make the top 10 risk factors, which is why it's not on the pie chart. In fact, about 80% of risk for CHD is due to the following seven factors: 1.) Type 2 Diabetes, 2.) Metabolic Syndrome (insulin resistance), 3.) Hypertension (high blood pressure), 4.) Obesity, 5.) Smoking, 6.) High Triglycerides, and 7.) Being Overweight. These seven items constitute about 80% of the risk factors for CHD. This does not mean that LDL-C is not important, but it means that there are other factors which may be more important in controlling CHD risk. According to Table 2 in the above referenced study, people under age 55 with Diabetes have a hazard ratio (HR) of 10.71. Those with Metabolic Syndrome have a HR of 6.09. Hypertension HR is 4.58. You can look up the rest yourself, but you will notice that the HR for LDL-C is only 1.38. It is a small amount of risk compared to the other risk factors.
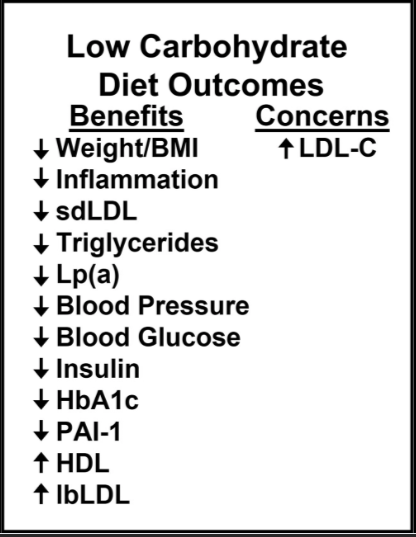
Let's look at this a slightly different way. Consider the 2022 paper published in Endocrinology, Diabetes, and Obesity called Statin therapy is not warranted for a person with high LDL-cholesterol on a low-carbohydrate diet. This paper reviewed 276 studies. They found that a low-carb diet "leads to significant improvements in the most robust lipid risk markers for CVD." The paper also noted that a low-carb diet can increase LDL-C in some people. Look at the figure below, taken from the study, showing how many CVD biomarkers are improved with a low-carb diet, yet LDL-C increases. All of the biomarkers under "Benefits" have far greater hazard ratios than LDL-C if uncorrected. So it does not seem possible that an increase in LDL-C as a result of a low-carb diet would cause a net increase in CVD risk given all the benefits conferred. LDL-C alone may not be the root cause of CVD.
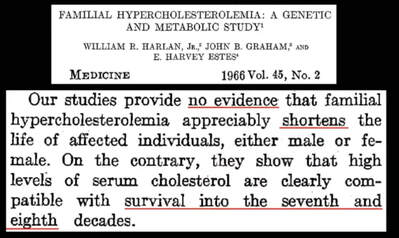
However, even in light of the dominant risk factors above, there is still a small risk associated with LDL-C according to this study and others. We should take that seriously. The hazard ratio for LDL-C is above 1.0, so some risk must exist, right? Let's again look at the group of people with the highest levels of LDL-C, called Familial Hypercholesterolemia, to take a closer look at risk for the group of people with the worst case scenario. Way back in 1966 there was a study called Familial Hypercholesterolemia: A Genetic and Metabolic Study. In the study the authors specifically state that "Our studies provide no evidence that familial hypercholesterolemia appreciably shortens the life of affected individuals, either male or female. On the contrary, they show that high levels of serum cholesterol are clearly compatible with survival into the seventh and eighth decades." Here is the actual print:
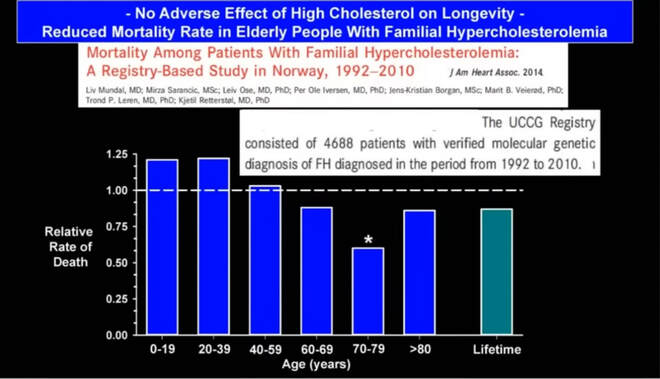
This seems surprising given that most doctors consider LDL-C and TC to be such a great risk and given that the hazard ratio of LDL-C is greater than 1.0. But, this is an old study, so perhaps it's outdated. Let's look at more recent data to see how it compares. A 2014 study in the Journal of the American Heart Association, called Mortality Among Patients With Familial Hypercholesterolemia: A Registry-Based Study in Norway, 1992-2010, looked at the effect of high cholesterol on longevity. They found reduced mortality in people with FH who were over the age of 59, in spite of their very high cholesterol levels, compared to the average. In the graph below, 1.00 is the average rate of death for the entire population. Anything under 1.00 means that those people live longer than average. The people on this graph are all people with extremely high LDL-C, and once they are over age 59 they have longer life expectancy than people with average LDL-C. Here is what the data looks like:
This seemed odd to me when I first observed this data, so I went to The American College of Cardiology which has a risk calculator available to the public. Their risk calculator is programmed to give you an idea of your risk of ASCVD based on assumptions that they consider to be important. I inputted my own data, at that time, as follows: age:49, sex:male, race:white, blood pressure:120/80, total cholesterol:230, HDL-C:60, LDL-C:160, Diabetes:No, Smoker:Never, Hypertension Treatment:Yes, Statin:No, Aspirin:No. The algorithm gave me a Lifetime Risk of 50%. You can enter my numbers in the calculator to confirm. Then I assumed that I might magically cut my LDL-C in half by reducing it from 160mg/dL to 80mg/dL. The algorithm gave me a Lifetime Risk of 50% again. No reduction in lifetime risk by cutting my LDL-C in half according to The American College of Cardiology. That was surprising.
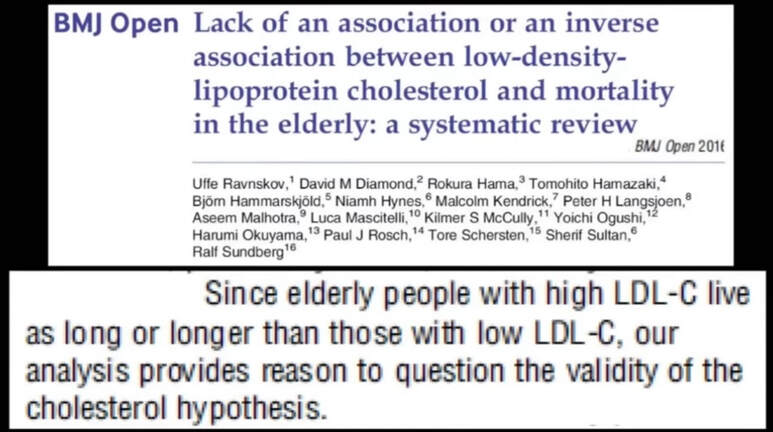
This finding prompted me to continue researching. A study in the BMJ Open called Lack of an association or an inverse association between low-density-lipoprotein cholesterol and mortality in the elderly: a systematic review looked at the relationship between LDL-C and longevity. The authors found that "Since elderly people with high LDL-C live as long or longer than those with low LDL-C, our analysis provides reason to question the validity of the cholesterol hypothesis." You can read the entire study at the link in blue above, and here is a quick print:
Let's summarize what we've discussed so far. While LDL-C is the primary biomarker that most doctors use to determine risk of ASCVD much of the scientific literature shows that increased levels of LDL-C may actually increase longevity. To this point it seems reasonable to question the accepted lipid-heart hypothesis. Perhaps LDL-C is not the root cause of ASCVD, CVD, and CHD. But if LDL-C is not the cause of CHD then what is?
This is NOT medical advice. Consult your doctor for medical advice.
Section III - Other Possible Causes of ASCVD
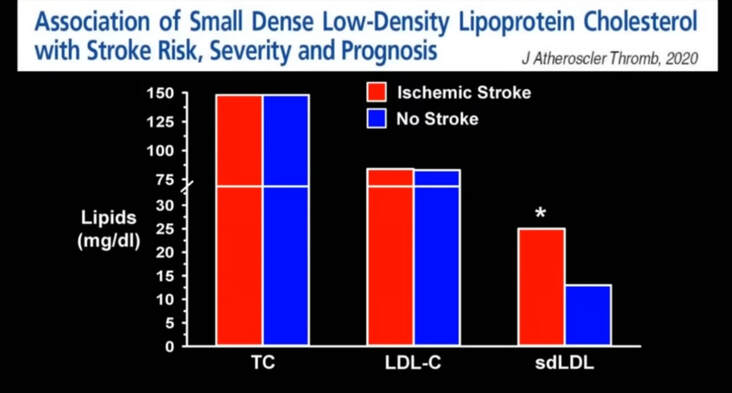
As we discussed above, cholesterol is largely carried inside of the LDL particle. These LDL particles can be large-fluffy or small-dense depending on the health and life phase of the particle. There is data that shows that small-dense LDL particles may be partly responsible for CHD and ASCVD instead of LDL-C. A 2020 study was published in the Journal of Atherosclerosis and Thrombosis entitled Association of Small Dense Low-Density Lipoprotein Cholesterol with Stroke Risk, Severity and Prognosis. The study looked at stroke events and the relation to lipids. The authors found the TC and LDL-C did not affect incidence of stroke, but small-dense LDL (sdLDL) did have an affect on the incidence of stroke. As you can see in the graph below, TC and LDL-C levels were the same in the group that experienced strokes and the group that did not experience strokes. However, sdLDL levels were twice as high in the group that experienced strokes compared to the group that did not experience strokes. Perhaps sdLDL is a confounder that we speculated in Section I of this article. You may remember from the pie chart above that sdLDL was one of the risk factors that was in the top 10.
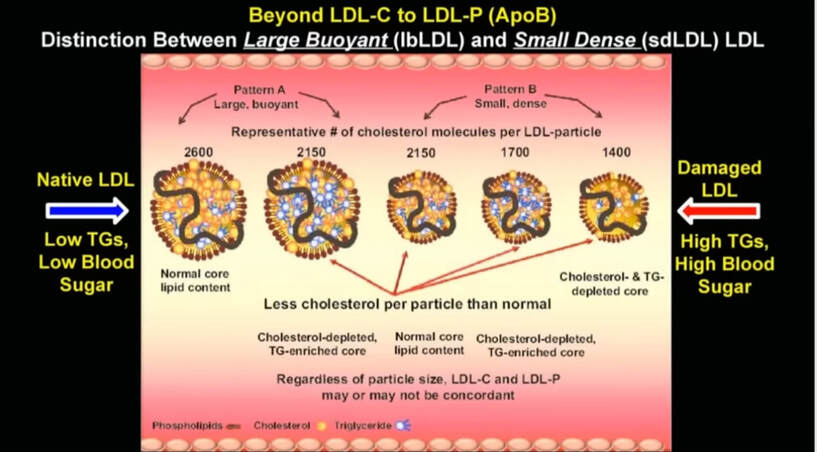
This diagram directly below, provided by Dr. David Diamond, shows the smaller dense sdLDL particle compared to the larger fluffy LDL particle. Note that, according to the diagram, the larger fluffy particles are supposedly associated with low triglycerides and low blood sugar, while the smaller dense particles are associated with high triglycerides and high blood sugar. We'll explore this.
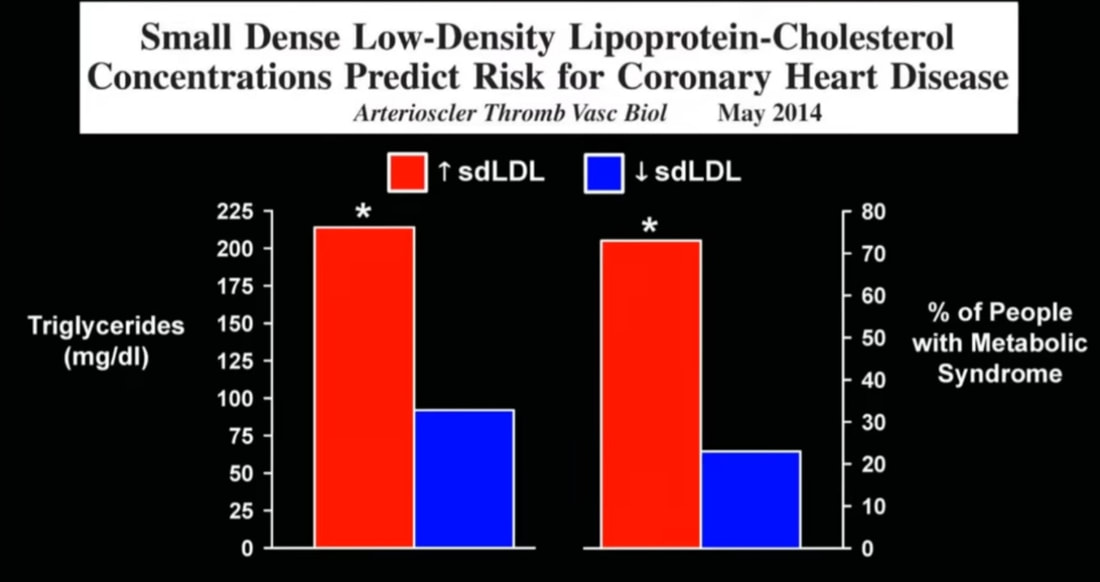
What does the scientific literature say about sdLDL as it relates to triglycerides and blood sugar? A 2014 study published in Arteriosclerosis, Thrombosis and Vascular Biology looked at this question. The name of the study is Small Dense Low-Density Lipoprotein-Cholesterol Concentrations Predict Risk for Coronary Hearty Disease, and it found that people with high sdLDL also had high triglycerides and increased metabolic syndrome. Metabolic syndrome, according to the American Heart Association, is defined as having three or more of the following five factors: high blood glucose, low HDL-C, high triglycerides, large waist circumference, and high blood pressure. As you can see in the graph below this study confirms that sdLDL is a biomarker of metabolic syndrome.
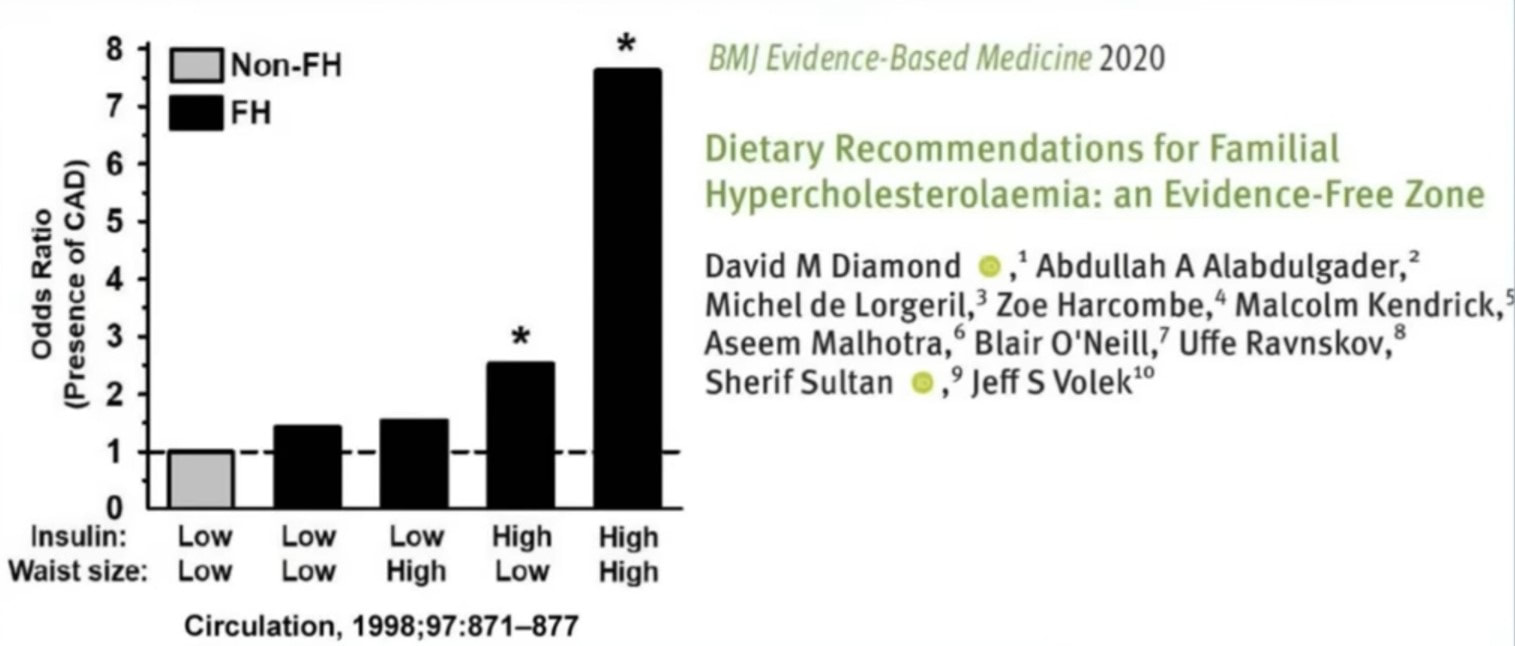
Let's look at the relationship of insulin with heart disease. Insulin is a hormone that controls glucose levels in our blood, thus it is very important in understanding metabolic syndrome. The BMJ Evidence Based Medicine published a 2020 study entitled Dietary Recommendations for Familial Hypercholesterolaemia: an Evidence-Free Zone in which they looked at the metabolic markers of insulin and waist size as it relates to Coronary Artery Disease (CAD). The study looked at odds ratios (OR) instead hazard ratios (HR). The difference between OR and HR is that HR tells us risk at any point in time while OR tells us risk at a specific point in time. Again, this study looked at people with FH which means very high LDL-C levels. The main finding was that if people with FH had high insulin and a high waist size they had very high risk of CAD. But if people with FH had low insulin and low waist size they had very low risk. For comparison, the authors also looked at people without FH and found that those with low insulin and low waist size had no risk of CAD. This is Figure 4 directly from the study:
So, again, it appears that LDL-C may not necessarily be the root cause of ASCVD, CHD, CVD, and CAD. Now it looks as though insulin, waist size, sdLDL, triglycerides, blood glucose and metabolic syndrome might be more suspicious along with diabetes type 2, smoking, high blood pressure, obesity and being over-weight. So far we've mostly looked at people with FH which are people who have extremely high levels of LDL-C. According to the American Heart Association, only about 1 in 200 people have FH (0.5%). If LDL-C does contribute to ASCVD, then it seems likely that people without FH would have much lower risk of ASCVD.
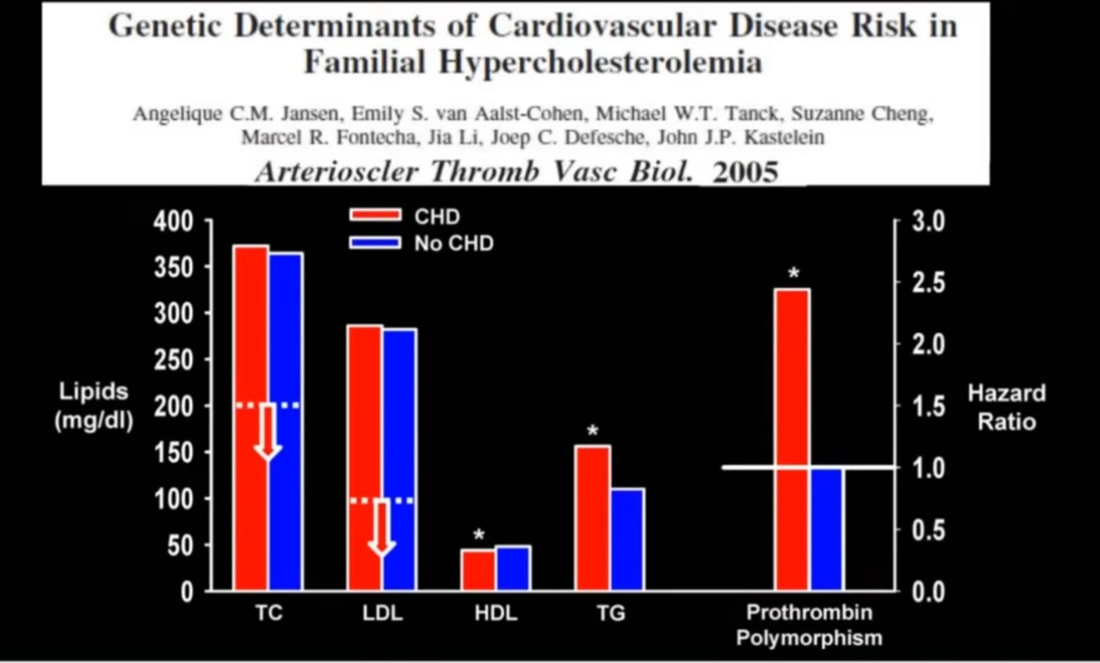
What else is responsible for higher risk of ASCVD and CHD if it's not LDL-C? Again, let's look at people with FH to observe what happens in the group of people with the highest LDL-C levels. A 2005 study published in Arteriosclerosis, Thrombosis, and Vascular Biology looked at other genetic factors that are associated with FH. The title of the study is Genetic Determinants of Cardiovascular Disease Risk in Familial Hypercholesterolemia. The authors found that TC numbers over 350mg/dL and LDL-C numbers over 270mg/dL did NOT determine whether a participant had CHD. You can see in the graph below that TC and LDL-C are the same for the population with CHD (red) and the population without CHD (blue). Table I in the full study shows that 66.9% of participants did NOT have CHD even with such high TC and LDL-C numbers. But the most profound finding was that a subset of these people with FH had a genetic anomaly for a blood clotting factor called Prothrombin. This clotting factor causes platelets to stick together spontaneously increasing the risk of CHD by more than double.
What else is responsible for higher risk of ASCVD and CHD if it's not LDL-C? Again, let's look at people with FH to observe what happens in the group of people with the highest LDL-C levels. A 2005 study published in Arteriosclerosis, Thrombosis, and Vascular Biology looked at other genetic factors that are associated with FH. The title of the study is Genetic Determinants of Cardiovascular Disease Risk in Familial Hypercholesterolemia. The authors found that TC numbers over 350mg/dL and LDL-C numbers over 270mg/dL did NOT determine whether a participant had CHD. You can see in the graph below that TC and LDL-C are the same for the population with CHD (red) and the population without CHD (blue). Table I in the full study shows that 66.9% of participants did NOT have CHD even with such high TC and LDL-C numbers. But the most profound finding was that a subset of these people with FH had a genetic anomaly for a blood clotting factor called Prothrombin. This clotting factor causes platelets to stick together spontaneously increasing the risk of CHD by more than double.
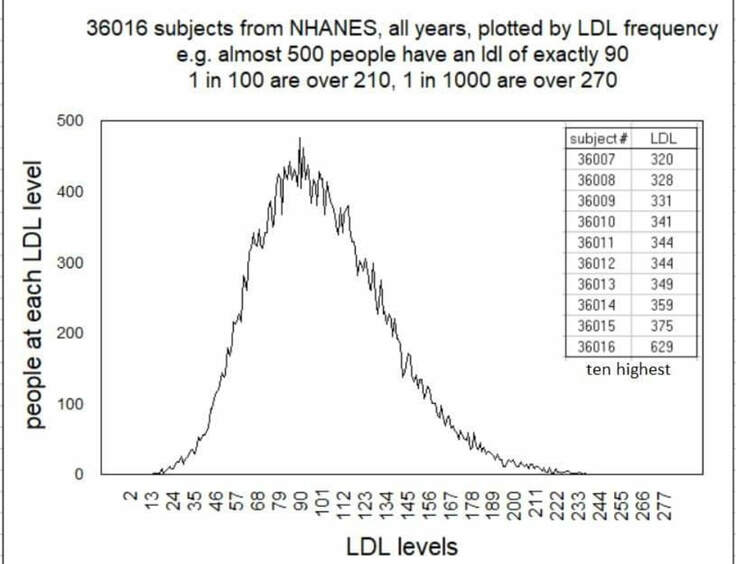
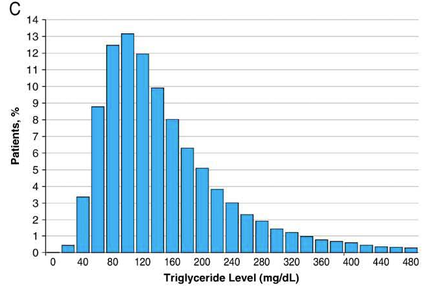
Let's look at the significance of this finding. The graph below contains data harvested directly from the National Health and Nutrition Examination Survey (NHANES). This data shows that the number of people in the general population with LDL-C levels at or above 270mg/dL (as in the study above) is 1 out of 1,000 people (0.1%). Yet, even though people in the above study had LDL-C levels in the top 0.1% there was still 66.9% of that population that had no CHD. Furthermore, there was a subset of people that DID have greatly increased risk of CHD, and these were people with the genetic anomaly of activated prothrombin.
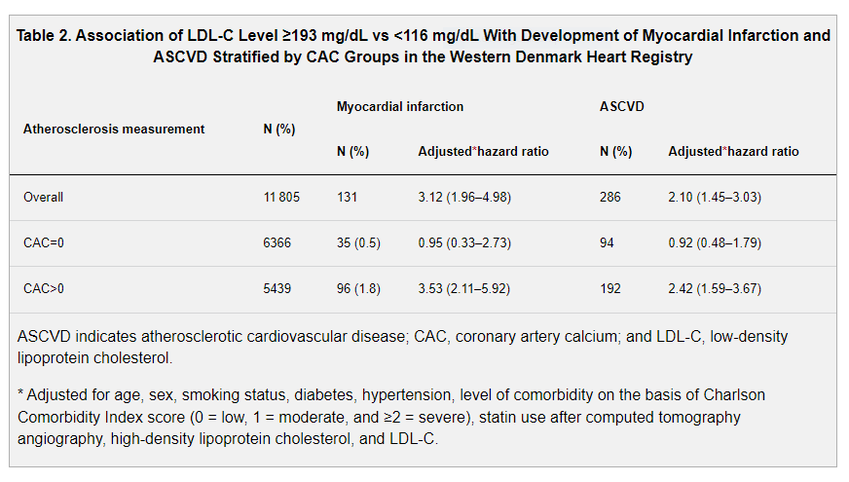
In another study, published by the American Heart Association in the publication Circulation in 2023, called Low-Density Lipoprotein Cholesterol Is Predominantly Associated With Atherosclerotic Cardiovascular Disease Events In Patients With Evidence of Coronary Atherosclerosis: The Western Denmark Heart Registry, the authors looked at CAC Scores. CAC stands for Coronary Artery Calcium, and it is a scan of the coronary artery that measures how much calcium is in the artery which can then be used to interpret how much hard plaque is in the artery. This can indicate ASCVD. There were 11,805 participants that all had LDL-C over 193mg/dL for life (which is FH level), and 53.9% had zero CAC scores. That means that 53.9% had no plaque in the coronary artery even with LDL-C over 193mg/dL for life. Something else must be causing the plaque instead of LDL-C.
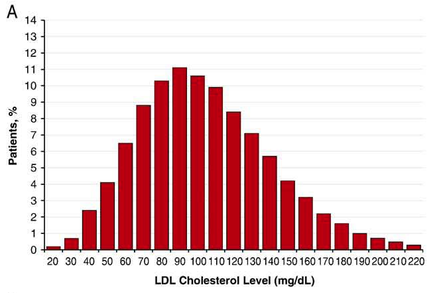
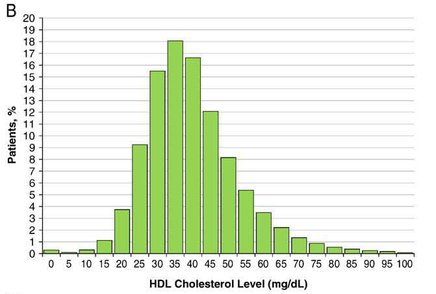
A 2009 study published in American Heart Journal entitled Lipid levels in patients hospitalized with coronary artery disease: An analysis of 136,905 hospitalizations in Get With The Guidelines showed that "Almost 75 percent of heart attack patients fell within recommended targets for LDL cholesterol" according to principal investigator Dr. Gregg Fonarrow, and almost half had LDL-C levels under 100mg/dL. Something other than LDL-C must be causing these heart attacks. In addition, "More than half the patients have admission HDL levels <40 mg/dL." In the chart below, from the study, you can clearly see that only about 20% of these heart attack patients had an LDL-C over 130mg/dL, and about 90% had HDL-C under 60mg/dL. You can also see that about 87% had triglycerides over 80mg/dL.
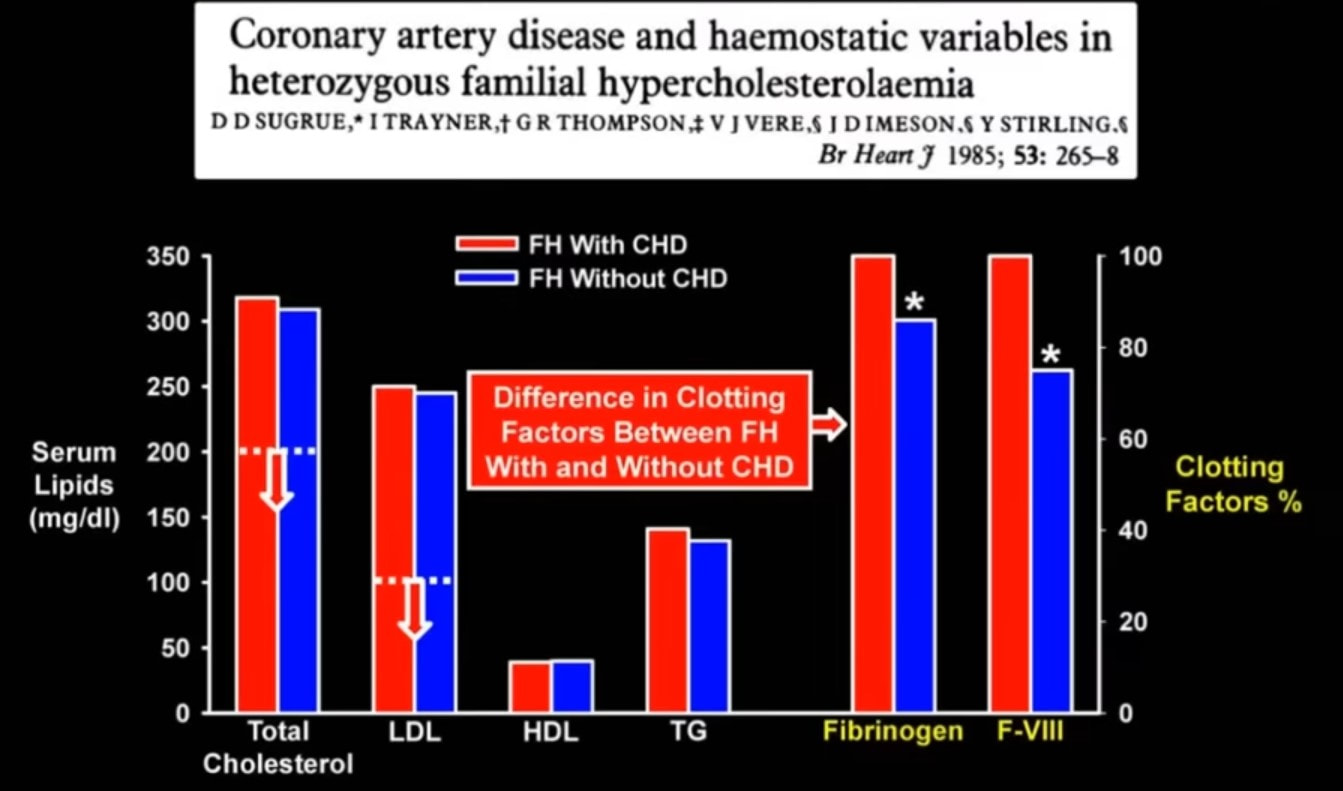
A study in BJM Heart called Coronary artery disease and haemostatic variables in heterozygous familial hypercholesterolaemia from 1985, before the existence of cholesterol lowering drugs like statins, looked at other factors. The authors found that, again in the presence of extremely high TC and LDL-C, CAD risk was determined by Fibrinogen and Factor VIII and not TC and LDL-C.
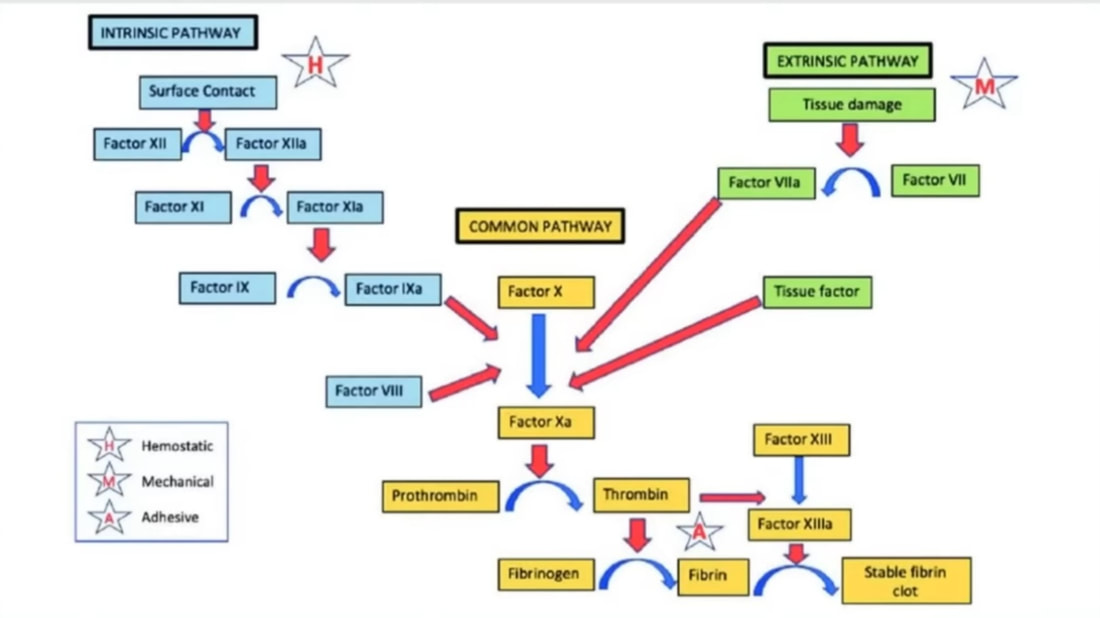
The diagram below shows a common clotting pathway. Notice that Prothrombin, Fibrinogen, and Factor VIII are all key components of the pathway. But these components alone do not necessarily mean they are activated to cause clots and heart attacks. What activates these components? Stress, hypertension, and high blood sugar.
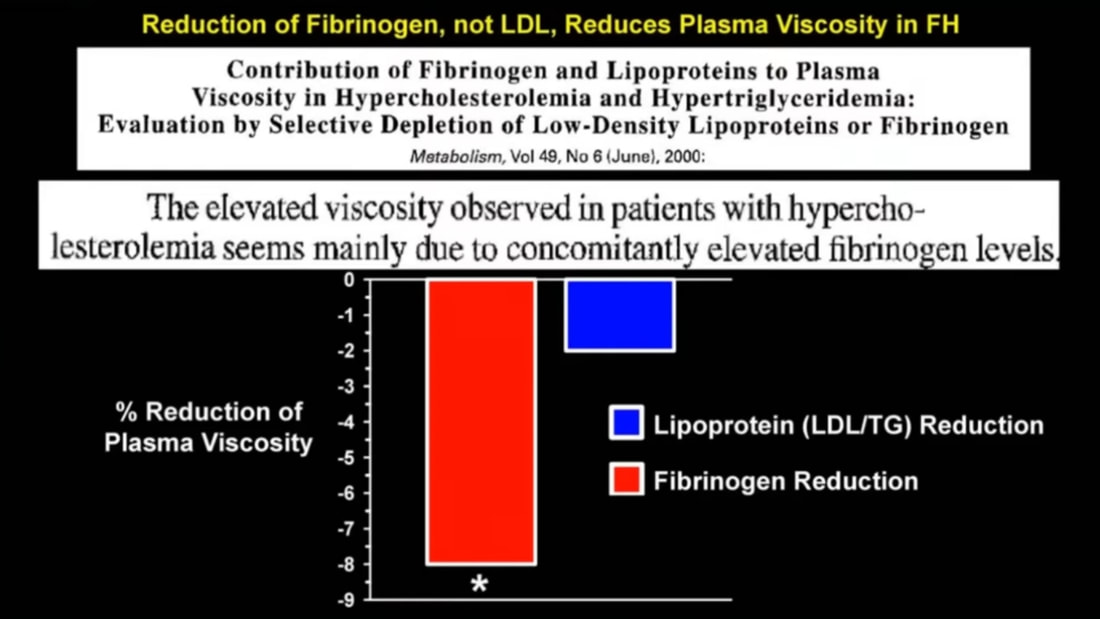
Another study, published in Metabolism in 2000, entitled Contribuition of Fibrinogen and Lipoproteins to Plasma Viscosity in Hypercholesterolemia and Hypertriglyceridemia: Evaluation by Selective Depletion of Low-Density Lipoproteins or Fibrinogen determined that "The elevated viscosity observed in patients with hypercholestolemia seems mainly due to concomitantly elevated fibrinogen levels." This means that the blood was thicker and more prone to clotting because the FH group had higher fibrinogen levels. The graph below shows that when fibrinogen was reduced then blood viscosity decreased greatly, but when LDL and triglycerides were reduced then the blood viscosity only decreased minimally.
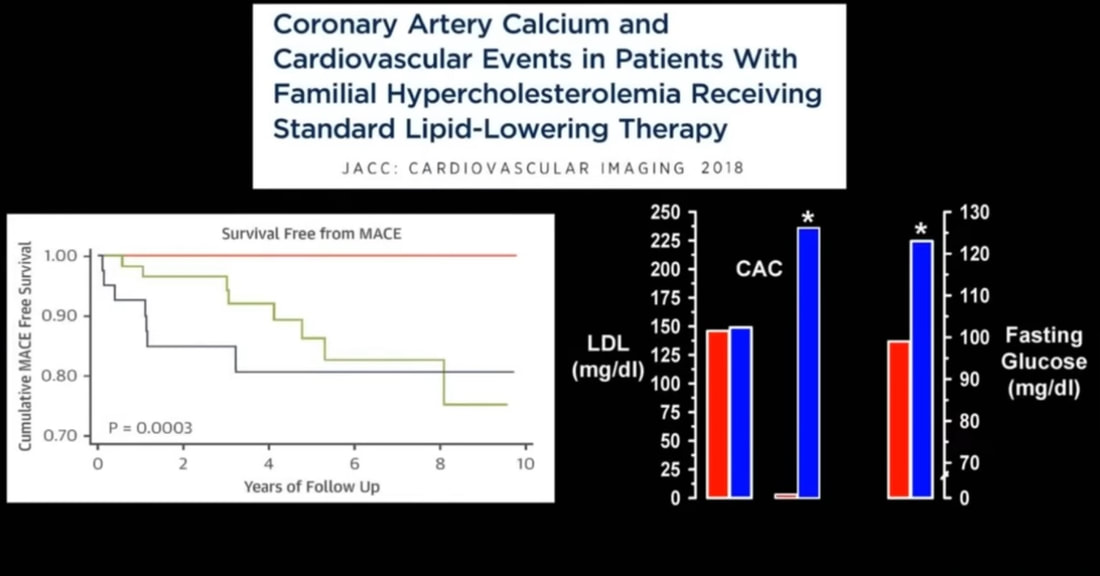
When we talked about sdLDL above it was discovered, through the 2014 study in that section, that metabolic syndrome is associated with sdLDL and CHD. And, as noted in that section of this article, the American Heart Association defines high blood glucose as a factor of metabolic syndrome. So, let's look at blood glucose more closely. Another study, printed in the Journal of the American College of Cardiology in 2018, entitled Coronary Artery Calcium and Cardiovascular Events in Patients With Familial Hypercholesterolemia Receiving Standard Lipid-Lowering Therapy, looked at two groups of people. The group in blue below are people that experienced ASCVD related cardiovascular events (heart attacks) and the group in red experienced no cardiovascular events. Note that both groups had the same LDL-C. Also note that the group that did not experience heart attacks had CAC scores of zero. And, then, notice that the group that did experience heart attacks had very high blood glucose levels. LDL-C was NOT related to heart attacks in this study, but fasting blood glucose was strongly related to heart attacks.
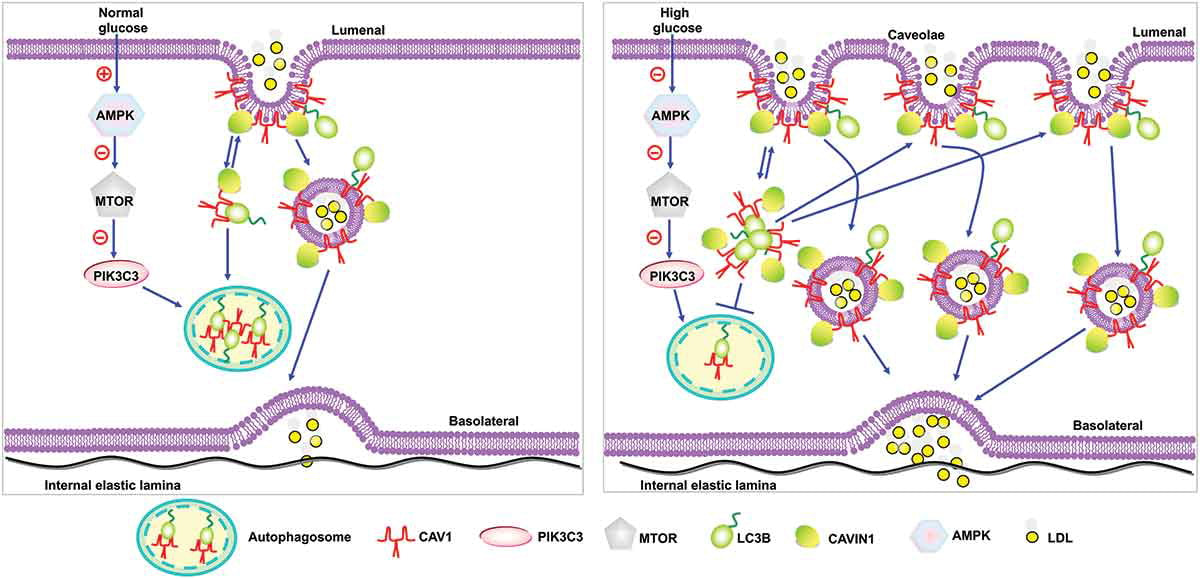
There are many mechanisms whereby blood glucose (sugar) contributes to ASCVD. We will not discuss them all, but this next study is particularly interesting. A 2020 study published in Autophagy called CAV1-CAVIN1-LC3B-mediated autophagy regulates high glucose-stimulated LDL transcytosis revealed a possible mechanism of action for ASCVD. The study explained that high levels of glucose in the blood stimulates transcytosis of LDL particles through the cells in the lining of arteries. In other words, high blood glucose is causing LDL to be transported through the cells of the lining of the arteries at very high rates. This is very, very significant because it explains why scientists may have mistakenly blamed LDL for causing ASCVD when high blood glucose may be the driving factor in reality. LDL may be an ingredient of plaque in the arteries, but glucose may be what is driving that LDL particle through the cell layer on the artery wall. If you recall from Section I, 93% of Americans are metabolically unhealthy, so perhaps it is high blood glucose that is partly responsible.
This section could go on for pages and pages with additional causes of ASCVD, but we'll stop here and move on to the next section.
This is NOT medical advice. Consult your doctor for medical advice.
Section IV - LMHR Phenotype
There is a special group of healthy, non-FH people with very high LDL-C levels. They are called Lean Mass Hyper-Responders (LMHR). These individuals have a special phenotype characterized by low triglycerides, med/high HDL-C, and lean body mass. When they consume a very low carbohydrate/high fat diet (keto) their LDL-C levels shoot up to 190mg/dL and higher. I personally fall into this group of people, and I've met perfectly healthy people with LDL-C levels over 500mg/dL while on low carb/high fat diets. What is more fascinating is when some of these LMHR's, with LDL-C of say 500mg/dL, eat Oreo Cookies for a couple days their LDL-C drops to 150mg/dL. Sounds crazy, right? How can Oreo Cookies lower LDL-C far better than most medications. It is explained by the Lipid Energy Model (LEM). Here is a study called Oreo Cookie Treatment Lowers LDL Cholesterol More Than High-Intensity Statin therapy in a Lean Mass Hyper-Responder on a Ketogenic Diet: A Curious Crossover Experiment that formally performed an experiment to prove this.
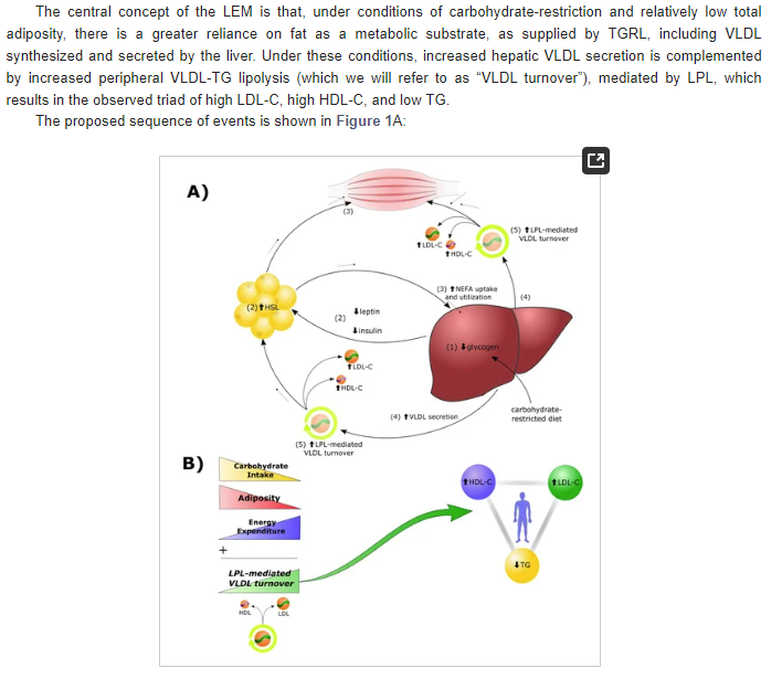
In 2022 the journal Metabolites published a study called The Lipid Energy Model: Reimagining Lipoprotein Function in the Context of Carbohydrate-Restricted Diets. The authors explain the phenomenon of resulting extremely high LDL-C levels when lean individuals eat Carbohydrate Restricted Diets (CRD). The diagram below briefly explains the mechanism of action.
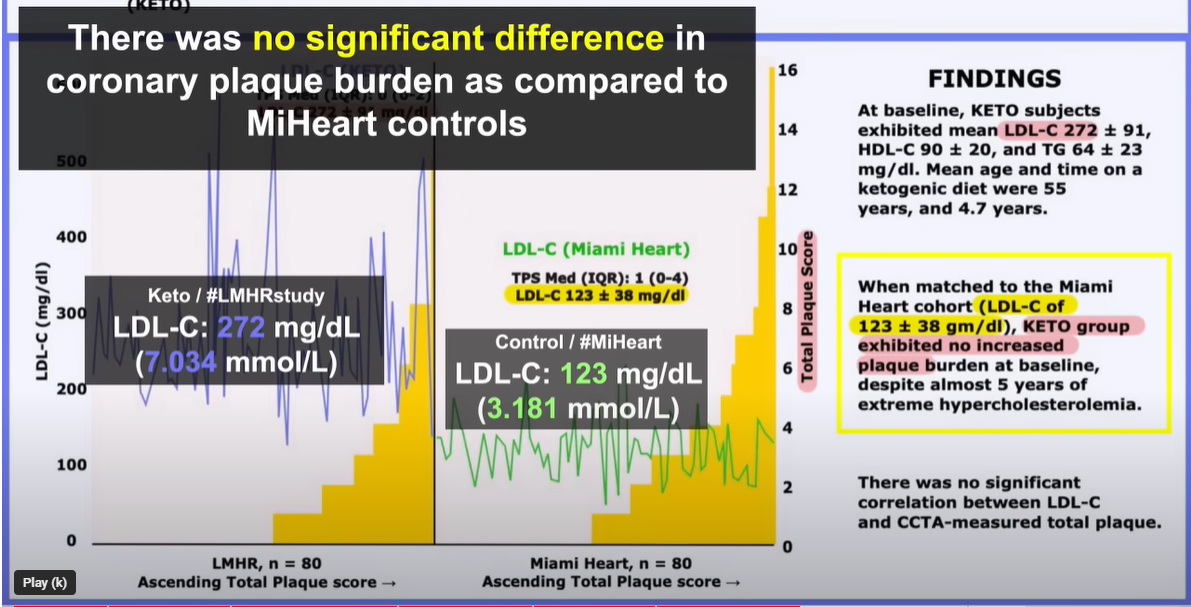
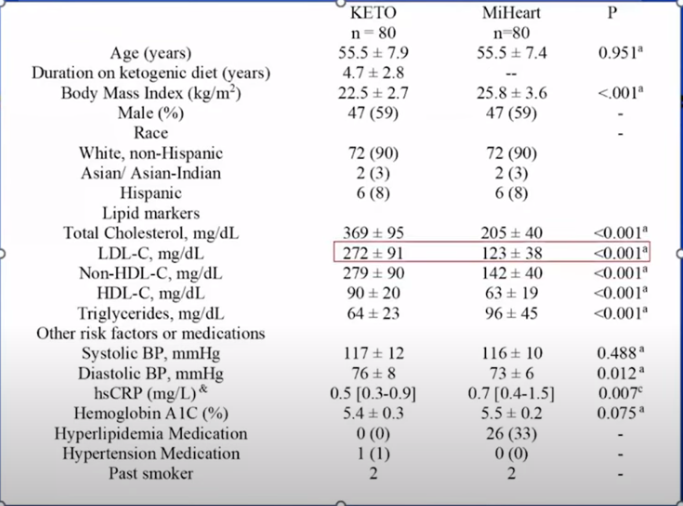
The greater question concerning the LMHR phenotype is whether or not people in this group are at higher risk of ASCVD with such extremely high LDL-C levels. To address this question the lead author, David Feldman, contacted world renowned cardiac radiologist Dr. Matthew Budoff. Dr. Budoff is probably the most knowledgeable person in the world on the subject of CAC and CTA imaging. He has over 1,600 publications in his name. They put together a study, the results of which were publicly shared on December 8, 2023. The print version of the study is not yet available online, but below are the results that were presented at the conference on December 8. What they found was NO DIFFERENCE in plaque between the LMHR group with very high LDL-C levels and a matched cohort from the Miami Heart study with low LDL-C levels. The LMHR group consisted of people that were on carbohydrate restricted diets, with average LDL-C levels of 272mg/dL, for an average of 4.7 years. The matched cohort had average LDL-C levels of 123mg/dL. These findings contradict the Lipid-Heart Hypothesis which states that LDL-C levels as high as the LMHR group participants should cause plaque in the arteries. The name of the study is Diet-induced Elevations in LDL-C and Progression of Atherosclerosis (Keto-CTA) and should be viewable in print soon. Here is a slide from the December 8 conference presentation.
If you take the graph of the LMHR Keto (CRD) group above and lay it upon the graph of the MiHeart group you see that the area under the curve is less in the Keto group. This means that the LMHR Keto group actually had slightly less plaque. In the table below you can see that subjects were matched very closely with the only variables being LDL-C, HDL-C, Triglycerides, and BMI as the phenotype would dictate. More investigation is necessary to make strong conclusions, but based on this study and studies discussed earlier in this article it is very likely that LDL-C alone does not cause ASCVD. Other factors and biological mechanisms must be involved.
This is NOT medical advice. Consult your doctor for medical advice.
Section V - Cholesterol Lowering Drugs
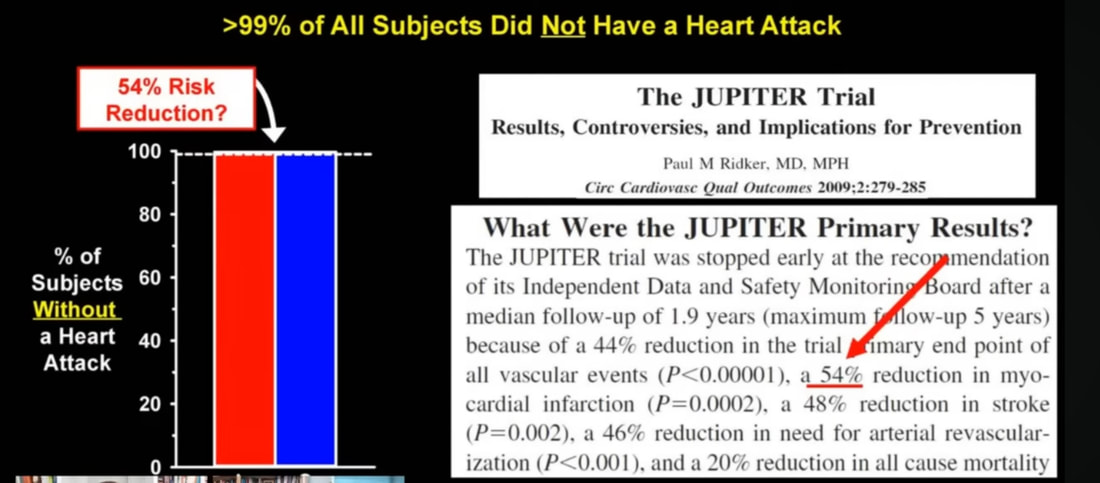
Statins - The most well-known cholesterol lowering drugs are statins. The American Heart Association specifically says "With a CAC score of 0, a 'no statin' approach is reasonable when diabetes mellitus, active smoking, or family history of premature coronary heart disease is absent," in a paper called Coronary Artery Calcium Score–Directed Primary Prevention With Statins on the Basis of the 2018 American College of Cardiology/American Heart Association/Multisociety Cholesterol Guidelines. Nonetheless, this drug was recommended to me by my physician many years ago without ever having done a CAC score, and I took the drug for several years with terrible side-effects until I did my own proper research. Statins block an enzyme called HMG-CoA reductase in the Mevalonic Acid pathway which results in lower amounts of cholesterol being produced by the body. It also results in lower amounts of other extremely important molecules that your body needs. You may have seen advertisements like the one below telling you that Crestor lowers heart attacks by 54%. What exactly does 54% mean?
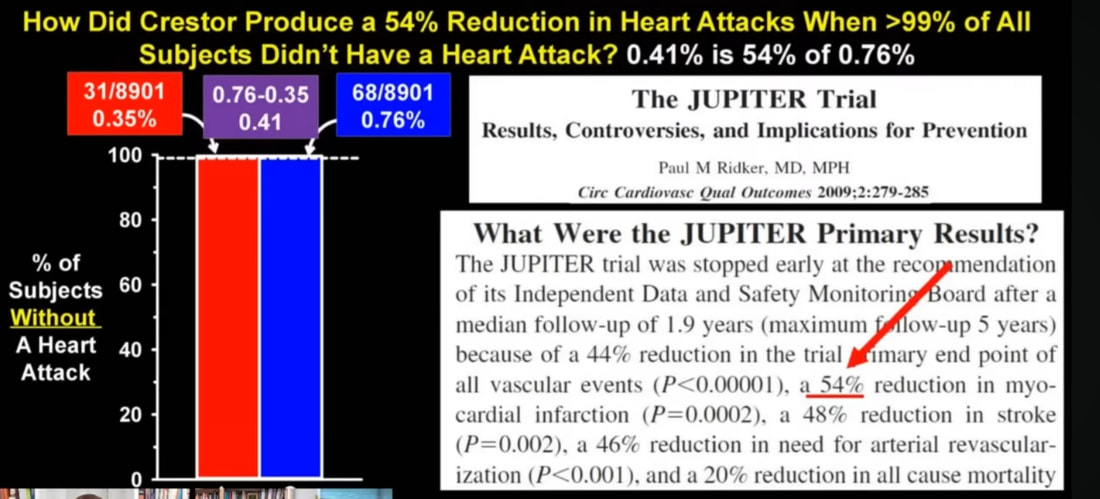
The American Heart Association journal called Circulation: Cardiovascular Quality and Outcomes published a 2009 study entitled The JUPITER Trial: Results, Controversies, and Implications for Prevention in which the authors looked at what 54% really means. In the red/blue graph below, the red group are the people who took a statin and blue group are people that did not take a statin in the study. It appears that the percent of subjects that did NOT have a heart attack was near 100% in both groups, so why does the study conclude that Crestor caused a 54% reduction in heart attacks? The answer is in the math.
Here is the math. You can follow these numbers in the graph below. Out of the people in the drug group (red) 0.35% had a heart attack during the study. Out of the non-drug group (blue) 0.76% had a heart attack. When you subtract 0.35% from 0.76% you get a 0.41% difference. That means 0.41% fewer people had heart attacks in the drug group. And when you divide 0.41 by 0.76, you get a 54% decrease in heart attacks in the drug group compared to the non-drug group. This 54% is called relative risk. But really it's a 0.41% decrease in heart attacks which is called absolute risk. The advertisement uses math to make it appear as though there is a greater benefit to the drug than the reality.
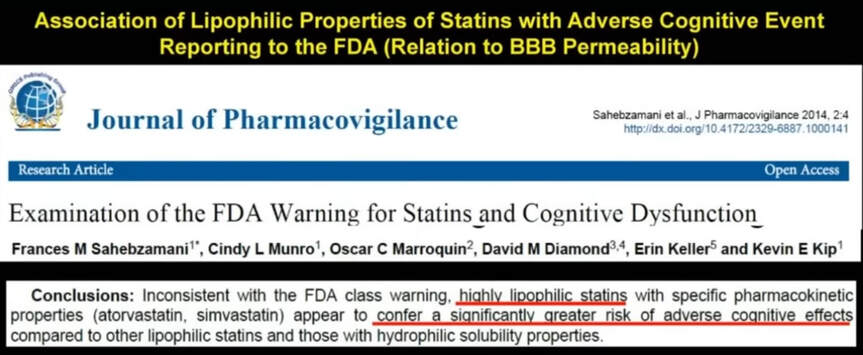
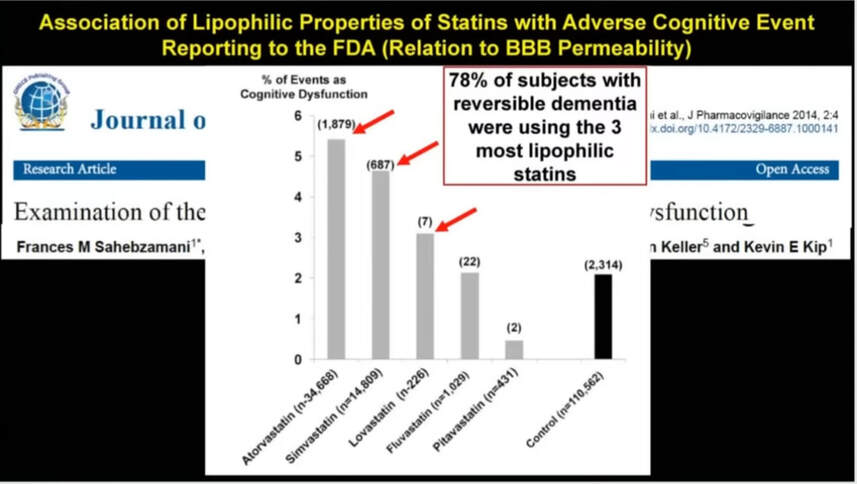
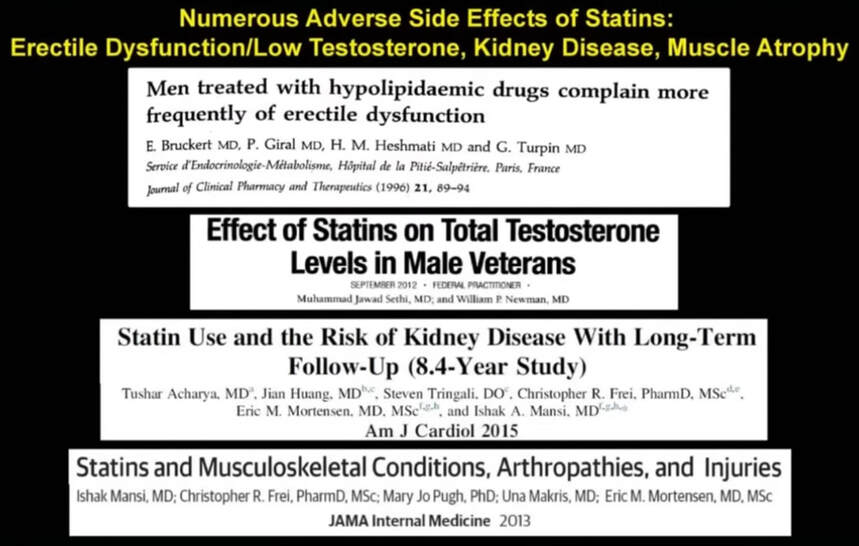
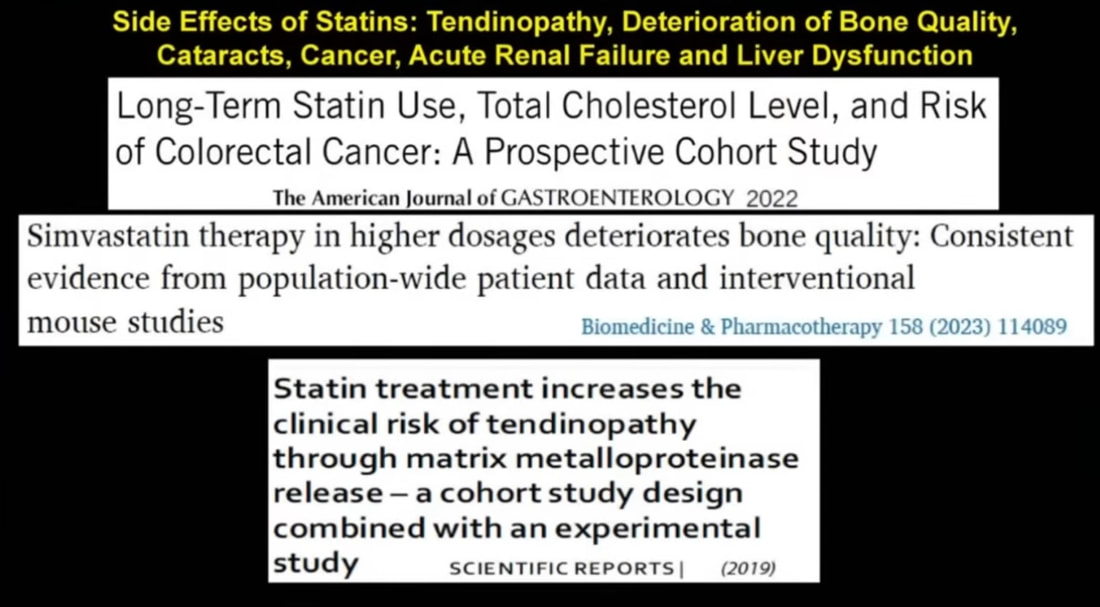
This deceptive math makes it difficult to make an informed decision about your health, especially given that there are many side-effects to these drugs. Statins are known to cause dementia, diabetes, muscle damage, erectile dysfunction, and kidney disease. I personally experienced life altering muscle pain from several different statins. Thankfully no permanent damage was sustained before I discontinued statin use. Two of my windsurfing friends, however, suffered permanent muscle damage from statins and are no longer able to windsurf. The following studies show that side-effects are far greater than what the drug companies want you to know. Simply perform an internet search by title to find links to each of these studies if you are interested in reading the full text.
Statins will reduced LDL-C in the blood. And, there may be some situations when statins may improve some health outcomes. Statins may provide a benefit of reduced cardiovascular events for people with high triglycerides, low HDL-C, and insulin resistance. However, side-effects still exist and must be considered.
Statins will reduced LDL-C in the blood. And, there may be some situations when statins may improve some health outcomes. Statins may provide a benefit of reduced cardiovascular events for people with high triglycerides, low HDL-C, and insulin resistance. However, side-effects still exist and must be considered.
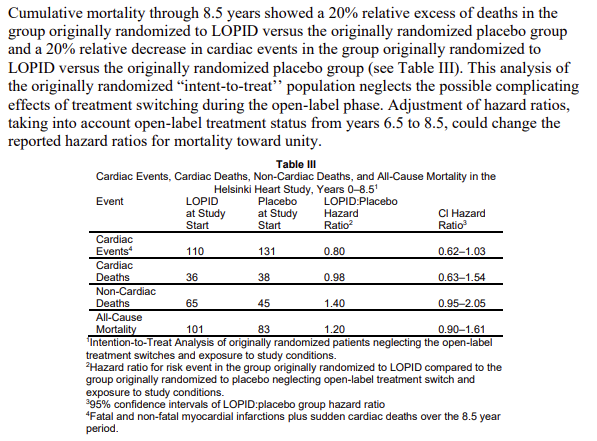
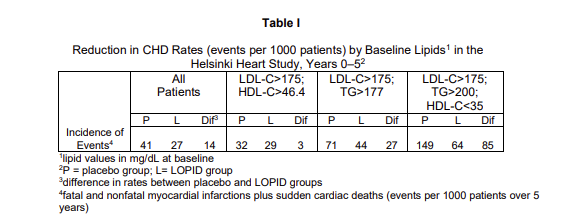
Fibrates - There is another class of drugs known as fibrates. This drug was just recently recommended to me by my physician. This time I did proper research before accepting the drug. After investigating the drug I refused to take it. Let's look at what the studies show. The New England Journal of Medicine published a study in 1985 called Helsinki Heart Study: Primary-Prevention Trial with Gemfibrozil in Middle-Aged Men with Dyslipidemia. The study looked at Gemfibrozil which is a type of fibrate. The LOPID product was used in this trial which is a brand. When you receive the product packaging for LOPID it contains documents which refer to this Helsinki Heart Study as proof of the drug's safety and effectiveness. Have you ever read it? I did. The first thing I noticed was the product packaging said "Cumulative mortality through 8.5 years showed a 20% excess of deaths in the group originally randomized to LOPID versus the originally randomized placebo group." Knowing that 20% (relative risk) more people died in the LOPID group was not a big selling point for me. In the chart below you see the hazard ratio of 1.20 for the All-Cause Mortality of LOPID-to-Placebo which means a 20% increase in death in the LOPID group. But, the product packaging also showed "a 20% relative decrease in cardiac events in the group originally randomized to LOPID versus the originally randomized placebo group." This 20% is relative risk. Relative risk was explained in the section on statins above. I was intrigued, however, that the drug reduced cardiac events by 20% (relative risk), which is shown as a hazard ratio below of 0.80. But how can the drug reduce heart attacks yet increase death? Well, it's how the participants in the study are grouped. Let's take a look.
Table I below shows three groups of people that were separated in the study. All three groups had LDL-C over 175mg/dL. The second and third groups in Table I below had high triglycerides and low HDL-C which was under 35mg/dL in the third group, and these two groups did receive benefit against heart attacks from the drug compared to placebo. But the first group had normal triglycerides and HDL-C over 46.4mg/dL, and this group had no significant benefit from the drug as shown by a difference of 3 between the placebo and LOPID group (which equates to 0.3% absolute risk difference in cardiac events). So for people with normal triglycerides and HDL-C above 46.4mg/dL there was no significant benefit in reducing heart attacks and there was a 20% increase in death. Not difficult to make a decision about taking this drug, especially after reviewing the side-effects. The drug's mechanism of action reduces VLDL particles made by the liver which are the particles that transport triglycerides throughout the body. My first reaction to this learning this was to question whether those triglycerides would then clog up the liver. As it turns out, the most common adverse effect from fibrates is deranged ALT and AST, which are liver enzymes that indicate liver inflammation when deranged.
Fribrates will reduce LDL-C in the blood while also reducing triglycerides and increasing HDL-C. There are some situations when fibrates may improve some health outcomes. Fibrates may provide a benefit of reduced cardiovascular events for people with high triglycerides, low HDL-C, and insulin resistance. However, side-effects still exist and must be considered.
PCSK9 Inhibitors - The liver produces an enzyme called PCSK9. One of its purposes is to regulate the amount of LDL-C in the blood. A liver cell has structures called LDL receptors that pull LDL particles out of circulation. The PCSK9 enzyme can bind to LDL receptors to block these receptors from pulling LDL particles out of circulation resulting in more LDL particles remaining in the blood when needed for human function. PCSK9 inhibitors are a class of drug that stops the PCSK9 enzyme from performing this particular function. If PCSK9 cannot block LDL receptors then LDL receptors can take much of the LDL particles out of circulation. Your LDL-C will then be much lower.
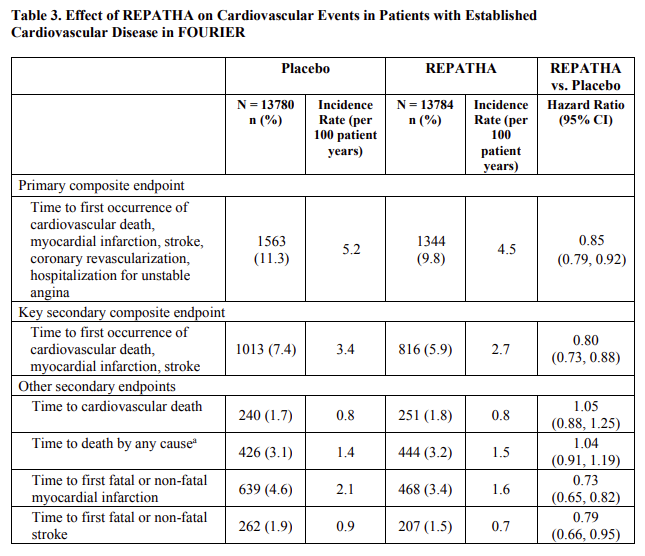
PCSK9 inhibitors are very good at lowering LDL-C. But how good are they at reducing death and cardiovascular events? The chart below is taken directly from the drug company product packaging insert for the PCSK9 inhibitor called Repatha. In the first row, you will notice that Repatha reduced primary cardiovascular events by 1.5% (11.3 minus 9.8). Likewise, in the second row, you will notice that Repatha reduced secondary cardiovascular events also by 1.5% (7.4 minus 5.9). Repatha has a small benefit in reducing heart attacks according to this study conducted by the manufacturer. In rows three and four, you will notice that Repatha increased deaths by 0.1% in both rows. While 0.1% is not statistically significant it also does not show Repatha to be effective at reducing deaths.
What this Repatha study does not do is to separate the findings by triglyceride and HDL-C levels like the LOPID study did. While there is a benefit in reduction of cardiovascular events for this overall Repatha group we do not know if there would be a benefit to a Repatha group isolated by healthy levels of triglycerides and HDL-C.
PCSK9 inhibitors will dramatically reduce LDL-C in the blood. And, there may be some situations when PCSK9 inhibitors may improve some health outcomes. PCSK9 inhibitors may provide a benefit of reduced cardiovascular events, especially for people with high triglycerides, low HDL-C, and insulin resistance as statins do. However, side-effects still exist and must be considered.
Other Drugs - I will not cover other cholesterol lowering drugs in depth, but these drugs would include ezetimibes and bempedoic acid. Each of these drugs are designed to lower LDL-C and come with their own adverse side-effects.
This is NOT medical advice. Consult your doctor for medical advice.
Section VI - Interpreting Your Blood Work
Many of the accepted bloodwork ranges that you see next to your lab results are just plain wrong. It is important to understand why they are wrong and what the correct ranges are for your bloodwork. To understand this let's look at an example by examining ALT (Alanine Aminotransferase). ALT is a liver enzyme that you see on your Comprehensive Metabolic Panel (CMP). Elevated levels generally mean inflammation in the liver. This can be caused by many factors, but in today's modern society it is very often caused by the over-consumption of fructose resulting in non-alcoholic fatty liver. Fructose is found in table sugar, high fructose corn syrup, and many processed foods. When I login to my personal medical chart and look at my bloodwork results it says that ALT should be between 7 - 52 U/L. How do they arrive at that range? Well, they take the results of thousands of blood tests processed at the lab and they plot them as a normal distribution (bell curve) on a graph. Then they take two standard deviations from the mean and that gives them the range of 7 - 52 U/L for ALT. The issue is that in 1975 the normal distribution of ALT resulted in a curve which produced a range of 7 - 25 U/L because people did not have access to fructose in high concentrations at every corner store, cafeteria, vending machine, grocery store, hospital cafeteria, and school lunch room. The average person did not consume much fructose in 1975, so ALT levels were much lower and healthier on average. This is the problem. The true healthy range for ALT is 7 - 25 U/L like it was in 1975. But in 2023 the large majority of people have sick livers. Anything above 25 U/L means harmful inflammation in the liver, yet your lab is telling you that ALT levels as high as 52 U/L is normal. It is only normal if you consider sickness to be normal.
What blood tests are needed and what are the optimal ranges? There is no single resource I have found to conclusively answer this question, however, there is a good medical group called Levels that has interviewed several world renowned doctors for their views on bloodwork. Levels has a webpage that lists their top 12 blood tests that they understand to be necessary, and each blood test is explained by the doctors. I do NOT agree with all of the interpretations, and you will see why, but it is a good place to start. Take a moment to look at that webpage, and then I will go through it in more detail below.
This is NOT medical advice. Consult your doctor for medical advice.
Since this article is about cholesterol, I'm going to start with the standard lipid panel which consists of four measurements: total cholesterol (TC), LDL cholesterol (LDL-C), HDL cholesterol (HDL-C), and triglycerides (TG). Total cholesterol is useless. Don't even bother looking at it. It tells you nothing useful. LDL-C, if looked at as a single biomarker is also useless, but if viewed in the context of other biomarkers can have relevance. As we deeply explored above, a high level of LDL-C does not necessarily mean that plaque will accumulate in the arteries. The Western Denmark Heart Registry clearly shows that, even for people with FH and very high LDL-C levels over 193mg/dL for life, more than half of participants had zero CAC scores which means no plaque. So what other blood markers should go with LDL-C. The other markers are triglycerides, HDL-C, triglyceride-to-HDL-C ratio, VLDL, fasting insulin, HbA1c, fasting glucose, post-meal glucose, and HOMA-IR. These can be used to help determine if LDL-C may potentially be problematic. Again, LDL-C alone does not indicate whether you have a problem or whether you do not have a problem.
Triglycerides: Your triglycerides should be under 80mg/dL. The accepted standard-of-care range goes as high as 150mg/dL, but this is way too high for health. If your TG's are over 80mg/dL it means that you are eating too many carbohydrates which the liver is converting to fat, and an unhealthy amount of that fat is remaining in the blood.
HDL-C: This number should be over 60mg/dL. The accepted standard-of-care ranges say that HDL-C should be over 40mg/dL for men and over 50mg/dL for women. This range is too low.
TG/HDL-C Ratio: This is calculated by simply dividing your TG by your HDL-C. The ratio should be less than one. For example, if your TG's are 65mg/dL and you HDL-C is 70mg/dL, then the ratio is 65/70 = 0.93. The resulting ratio is less than one. As was seen in the Helsinki Heart Study, people with normal TG's and HDL-C, and LDL-C over 175mg/dL, showed far fewer heart attacks than people with high triglycerides and low HDL-C.
VLDL: This number is not always listed on a standard lipid panel, but you can calculate it yourself. Simply take the total cholesterol and subtract the LDL-C and HDL-C. For example, if your TC is 250mg/dL, LDL-C is 168mg/dL, HDL-C is 70mg/dL, then your VLDL is 250 - 168 - 70 = 12mg/dL. This number should be under 15mg/dL.
Fasting Insulin: Many studies reveal that blood glucose and metabolic syndrome are related to plaque in the arteries. Table 1 of this study from Science Direct is a good example. Fasting insulin affects blood glucose which is one of the five factors of metabolic syndrome. Your blood glucose may appear normal, but the reason it may appear normal may be because the beta cells of your pancreas are producing way too much insulin with a condition known as hyperinsulinemia. If the pancreas produces too much insulin then the cells of your body resist the insulin as discussed above, eventually allowing glucose to remain in the blood, and this can cause Type 2 Diabetes. Type 2 Diabetes is the biggest risk factor for heart disease according to this study from JAMA Cardiology. Keep your fasting insulin below 5 uIU/mL.
HbA1c: This is a measure of your average blood glucose over the past 3-4 months. Anything over 5.2% is too high. Work to reduce your HbA1c below 5.2%. This marker has great benefit if tracked at home a couple times per month. If tracked only a couple times per year at your doctor visit it has less value because, as the American Diabetes Association has published, approximately 60-70% of diabetes cases are missed when screening by HbA1c.
Fasting Glucose: Keep fasting blood glucose below 85mg/dL. This marker has great benefit if tracked at home several times per day. You may even consider employing a continuous glucose monitor. If tracked only a couple times per year at your doctor visit it has less value because, as the American Diabetes Association has published, approximately 50% of diabetes cases are missed when screening by fasting glucose.
Post-Meal Glucose: Keep post-meal blood glucose below 110mg/dL.
HOMA-IR: This is a measure of insulin resistance. Keep this below 1.
ALT and AST: As discussed in the example above, ALT is a liver enzyme. AST is an enzyme found in the liver and in other tissues. Values for both of these enzymes should be below 25 U/L. Anything above 25 U/L indicates that something is not right in the liver. The most common liver abnormality is the result of consuming too much fructose and concentrated carbohydrate resulting in fat and inflammation in the liver. Most people consuming high fructose also consume large amounts of glucose. If you recall from discussion above, 88-93% of Americans are metabolically unhealthy, so perhaps it is high blood glucose and/or high insulin that is partly responsible.
Gamma Glutamal Transferase (GGT): This becomes elevated when the body makes a lot of glutathione which can again reflect inflammation in the liver. This number should be below 25U/L, but 10 is ideal. If ALT, AST, and/or GGT are over 25U/L then it is likely that you are consuming too many carbohydrates creating fat in the liver. Compare this with triglycerides mentioned above. If triglycerides are over 80mg/dL and either ALT, AST, and/or GGT are over 25U/L then you are likely eating too many carbohydrates for healthy metabolism. Also compare these markers with VLDL. If VLDL is over 12-15mg/dL then you are probably eating too many carbohydrates for metabolic health. All of these blood markers are tied together. If insulin is over 5uIU/mL then you are probably eating too many carbohydrates.
Alkaline Phosphatase: This also gives an indication of inflammation in the liver. A number in the 50's U/L or lower means low inflammation.
C-Reative Protein (CRP): This is a marker of inflammation in the whole body. This should be less than 1mg/L, but 0.7 is better.
Ferritin: This is a marker of intracellular inflammation. Ideally this should be less than 100ng/mL.
Protein: Determining how much protein you should be eating can be gauged and guided by three blood markers. BUN, Creatinine, and Uric Acid. BUN should generally be between 18-22mg/dL. More than that could indicate you are eating too much protein or not enough fat. Less could indicate not enough protein or that you are still sugar dominant and you don't need sugar from protein. This is a guide and not a hard rule because other things can affect BUN. Creatinine should be below 0.9mg/dL. More than that may indicate you eating too much protein. A number of 0.7mg/dL is even better for some people. Uric acid should ideally be below 5.5mg/dL. If BUN is low and uric acid is high it could mean that your body is doing a lot of autophagy in which case you are breaking down muscle protein for use in other places thereby allowing protein to spill out uric acid.
Thyroid: The thyroid can get complicated, but let's keep it simple for purposes of basic metabolism. TSH is produced in the brain, and it stimulates the production of hormones in the thyroid. In overly simplified terms, TSH stimulates the production of T4 which gets converted to T3, and Free T3 is the useable form. If TSH is high that generally means that the thyroid is not responding very well to TSH so the brain keeps making more and more TSH. If Free T3 is low that generally means that the amount of TSH being made is not enough to stimulate the end result of adequate Free T3 or that the thyroid is otherwise sick. A basic guideline is that TSH should be below 3uIU/mL and Free T3 should be between 2.5-3.3pg/mL. When TSH and Free T3 are viewed together in this way it can be a useful tool in determining metabolic health. But this is complicated stuff and should be considered in the context of everything else under the guidance of a professional metabolic specialist.
Coronary Artery Calcium (CAC): This is a scan of the arteries in the chest to look at calcification which relates to plaque and atherosclerosis. Ideally your CAC score should be zero, but do not panic if the score is above zero. Contact a professional metabolic specialist and work in conjunction with your cardiologist.
Note: If a person is on a ketogenic diet then the optimal ranges of some blood tests may be outside the scope of understanding of most doctors. Most doctors simply do not know how to interpret blood work correctly for a person in ketosis, so a professional metabolic specialist may be needed.
If all of your above numbers are in the suggested ranges above then levels of LDL-C above the standard recommended levels will likely be safe in the range of 120-300mg/dL. This is the context of all the blood markers that was mentioned. LDL-C must be viewed in the context of these other markers. If these other markers are outside of the discussed ranges then you may need to consider making changes. Talk to a professional metabolic specialist. Nutrition and lifestyle changes are the most impactful factors. Medications are an option, but they will not fix what poor nutrition and lifestyle have created. Medications may fix some of the symptoms, and fixing symptoms with medications may extend your lifespan. However, fixing symptoms will not fix the root problems and will often mask the real problem thereby making things worse because you can't see the root cause. Sometimes fixing symptoms is the only option, but consider changing nutrition and lifestyle factors first. These nutrition and lifestyle factors will be discussed below in Section IX. It is interesting to note that I have personally learned that I can lower my LDL-C by doing the following 5 things: 1.) Get fat, 2.) Get sick, 3.) Stop exercising, 4.) Stop taking vitamins, and 5.) Eat junk food. Doing these unhealthy things will lower LDL-C.
If you are still concerned about the impacts LDL-C is having on your arteries then there are direct ways to check to see if you have plaque in your arteries. You can have the following tests performed: CAC, CT Angiogram, Coronary Intima Media Thickness. This article will not get into the details of these tests, but these tests will give you a picture of your current plaque situation.
This is NOT medical advice. Consult your doctor for medical advice.
Here is a full list of the blood tests that my personal metabolic specialist ordered for me. It includes the codes, and you can use it as a guide as you work with your doctor.
Section VII - Four Major Points
1. According to the study Association of Lipid, Inflammatory, and Metabolic Biomarkers With Age at Onset for Incident Coronary Heart Disease in Women (and many other studies), the top ten risk factors for CHD, in order, are Diabetes, Metabolic Syndrome, Hypertension, Obesity, Smoking, High Triglycerides, Being Overweight, High sdLDL, High CRP, and Inactivity. LDL-C has a hazard ratio (HR) far less than these top ten risk factors. For example, the HR for diabetes is 10.71, metabolic syndrome is 6.09, and hypertension is 4.58. But the HR for LDL-C is only 1.38, a small fraction of all other risk factors combined.
2. According to Paul M. Ridker, director of the JUPITER trial, "Of the nearly 1.7 million heart attacks and strokes that occur annually in the United States, more than half occur among apparently healthy men and women with average or low levels of cholesterol." So, he is saying that more than 50% of people still have heart attacks and strokes even if they have average or low cholesterol.
3. According to the Western Denmark Heart Registry study (and many other studies), more than 50% of FH patients, with average LDL-C over 193mg/dL for life (average age 57), have CAC scores of zero and ASCVD hazard ratios of 0.92 (no risk of ASCVD). This discovery, coupled with #1 above, indicates that there is a certain cohort of the population for which ASCVD is independent of LDL-C levels.
4. The Number Needed to Treat (NNT) is a tool used to illustrate how many people must be treated with an intervention (ie: drug), for a certain period of time, in order for one event (ie: heart attack) to be prevented. The website www.theNNT.com has taken data from scientific studies to provide the NNT for many diseases typically treated with drugs. For example, if statins are administered to people without known heart disease for 5 years, then the NNT, in order to prevent one heart attack, is 104 people during that 5 year period. An NNT of 104 is very typical for statins. But let's look at the NNT for a very specific study called the Jupiter trial, which showed a more favorable NNT for statin use. This was a study of people with normal LDL-C but very high risk hsCRP (inflammation) and no prior heart disease. The participants were treated with the drug Rosuvastatin (Crestor). The study explains that, "For the end point of myocardial infarction, stroke, revascularization, or death, the 5-year NNT within JUPITER was 20". That means that, over a 5 year period, 20 people (median age 66) had to be treated with Rosuvastatin to prevent one heart attack, stroke, or death related to those events. In other words, 19 people (95%) who took Rosuvastatin received no benefit during that 5 year period. But let's assume that these 66 year-old people live to age 76 on average. So, they would live through two of the 5-year periods. That means 90% (18 out of 20) would have no benefit from Rosuvastatin. Even if they lived through three of the 5-year periods, 85% would still have no benefit from Rosuvastatin. And this is the best case NNT for statin use. Statins clearly lower LDL-C, but this lowering of LDL-C has no benefit for at least 85% of people taking statins.
Four Points Conclusion: 1.) LDL-C contributes very minimally to risk compared to other CHD risk factors. 2.) The majority of people who have heart attacks do not have elevated LDL-C levels. 3.) The majority of people with very high LDL-C levels do not have ASCVD. 4.) The majority of people who take statins receive no benefit.
Section VIII - Easy To Understand Resources
Here are two easy to understand podcasts analyzing the science in a way that most people can understand.
1. The "Cholesterol Hypothesis": 10 Key Ideas That The Diet Doctors Have Hidden (Tim Noakes)
2. Hiding Unhealthy Heart Outcomes In Low-Fat Diet Trials (Tim Noakes)
1. The "Cholesterol Hypothesis": 10 Key Ideas That The Diet Doctors Have Hidden (Tim Noakes)
2. Hiding Unhealthy Heart Outcomes In Low-Fat Diet Trials (Tim Noakes)
Section IX - The Proper Human Diet
Here are the general rules we will discuss in another article with regard to the proper human diet.
1. Control Carbohydrates
2. Prioritize Protein
3. Don't Fear Fat
4. Eat a Maximum of Two Times per Day
5. Eat Real Whole Food
6. Choose Food For the Nutrients
2. Prioritize Protein
3. Don't Fear Fat
4. Eat a Maximum of Two Times per Day
5. Eat Real Whole Food
6. Choose Food For the Nutrients
A proper human diet deserves much attention. For information on this topic please read my article called Healing Chronic Disease. This will give you a picture of how to align your nutrition with nature in a way that will optimize your health. Good luck on your journey.
This article does NOT constitute medical advice. Consult with your physician before making any changes to your medical plan.
